Creating a current or historical cost price report can help you understand how much you have spent on products with your wholesaler and helps you to determine how much you have sold in a given period. This article will explain how to generate financial reports for current and historical prices.
Be aware: when granting a person access to reports, they automatically also have insights in your practice financials.
Definitions
Before we explain how to generate these reports, you need to be informed about our understanding of the definitions listed below.
- Cost Price: The actual price you pay a supplier for a product
- List Price: Your supplier’s list price for a product
- Sales Price: The price you sell each unit of a product
Where to find the cost, list and sales prices for a product
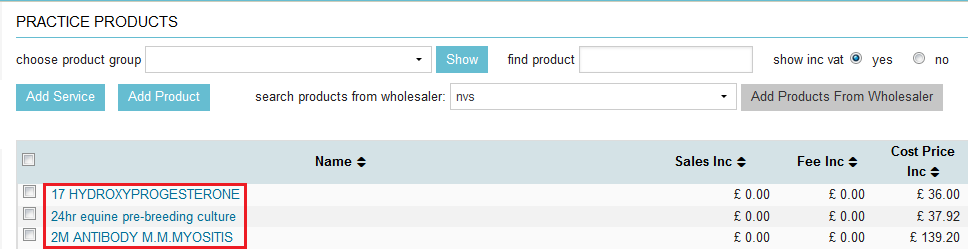
The cost, list and sales prices are defined at product level, you can view or edit these by browsing to extra> products > click on one of the products in the list that you want to view or edit:
Once you have clicked on the product you want to view or edit, a page similar to the one shown below, will appear. Here you can find the cost, list and sales price:
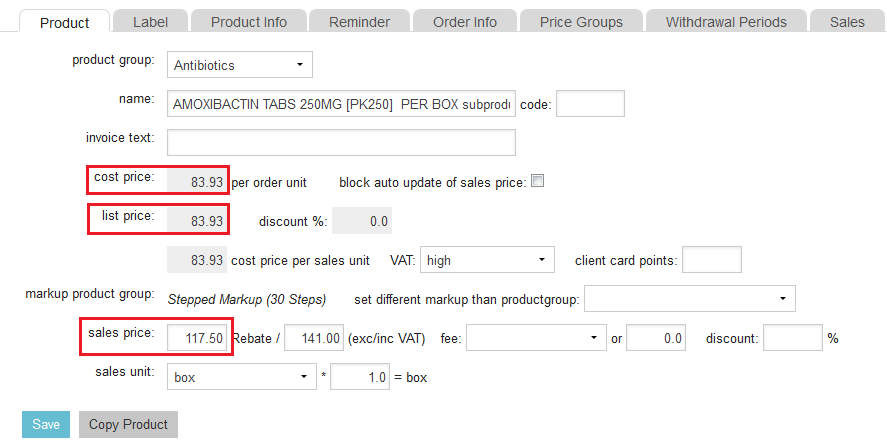
Some of these details are needed in order to fully understand the next two reports we will be discussing in this article. In the product page above the cost and list prices are shown for an order unit e.g. a box of tablets, whereas the sales price is shown for the sales units e.g. tablets.
How to create a ‘historical cost price’ report
In order to create a report you need to browse to Extra > Reports and click on Product in the left sidebar. At the top of the page you will have the opportunity to generate reports specific to product. If you want to see the historical cost price, make sure to select ‘historical cost price’ from the drop-down menu behind “show”.
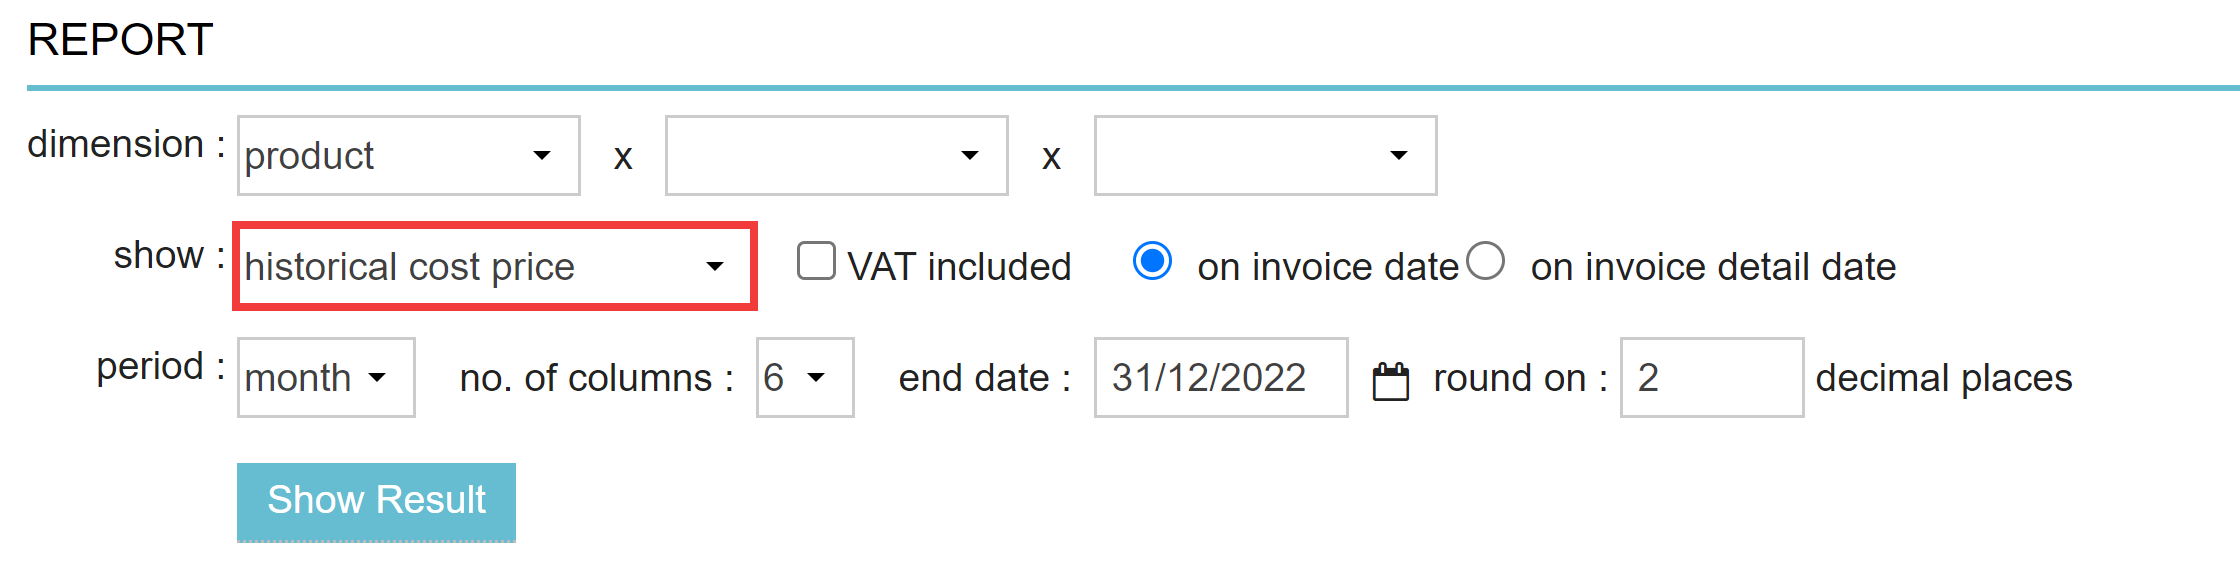
Click Show Result to generate the report.
With this report, products are shown with the cost price when the product was sold in the past. Please note that since historical cost prices are not saved before June 2016 this report will not give you any results when you include periods before that date.
How to create a ‘current cost price’ report
In order to create a report you need to browse to Extra > Reports and click on Product in the left sidebar. At the top of the page you will have the opportunity to generate reports specific to product. If you want to see the current cost price, make sure to select ‘current cost price’ from the drop-down menu behind “show”.
Click on Show Result to generate the report. The ‘current cost price’ report shows the total amount of products sold for the current cost price.
Example – Understanding the ‘current cost price’ report.
Have a look at the image shown below. What you are seeing is a ‘current cost price’ report from June ’16 to November ’16. The product Amoxibactin in this example, has a cost price of £84 per unit. In July you can see that this practice has sold a total amount of £168 worth of Amoxibactin at cost price. When you divide the £168 with the cost price per unit, which is £84, you will see that 2 units were sold in that month.
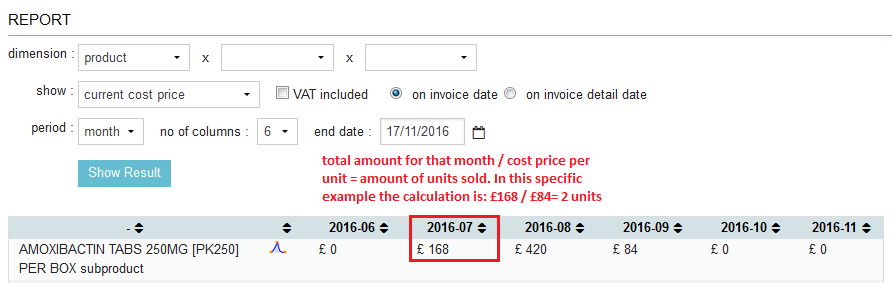
The same can be calculated for the other months as well. In some cases the value can be £0 which means you have sold 0 products that month. That is what this report is showing.
Other reporting options related to product pricing
When you click on the dropdown menu next to the field “show”, you will have different sorts of reports available.
Here is a quick overview of what these reports provide:
- Margin current cost price. The difference between the current cost price and the sales price when the product was sold
- Margin historical cost price. The difference between cost price when the product was sold and the sales price the product was sold at.
Note: Since historical cost prices are not saved before early 2016 this report won’t give you any results when you include periods before that date. For those earlier periods you will have to use “show: margin current cost price“. - Current list price. Products are shown with their current list price (as shown in Extra > Products > Products).
- Historical list price. Products are shown with the list price when the product was sold.
Note: Since historical list prices are not saved before early June 2016 this report won’t give you any results when you include periods before that. - Margin current list price. The difference between the current list price and the sales price the product was sold at.
- Margin historical list price. The difference between the list price when the product was sold and the sales price when the product was sold.
Since historical list prices are not saved before early June 2016 this report won’t give you any results when you include periods before that date. For those earlier periods you will have to use “show: margin current list price”.