Animana can generate reports for you on a variety of topics through its flexible reporting system. We have a lot of preset reports that you can use but apart from those, you can also build your own custom report. This article will explain how to create a custom report.
Before you start
- You need permission to be able to create a report. Permissions can be adjusted by practice administrators in
 > General Settings > Role Management.
 - Be aware: when granting a person access to reports, they automatically also have insights in your practice financials.
Step-by-step instructions
- Go to
 > Reports.
 - The Reports menu contains a list of predefined reports on the left. Each of these reports are based on a similar structure, but with preset fields. Click any report to get started, such as Product.

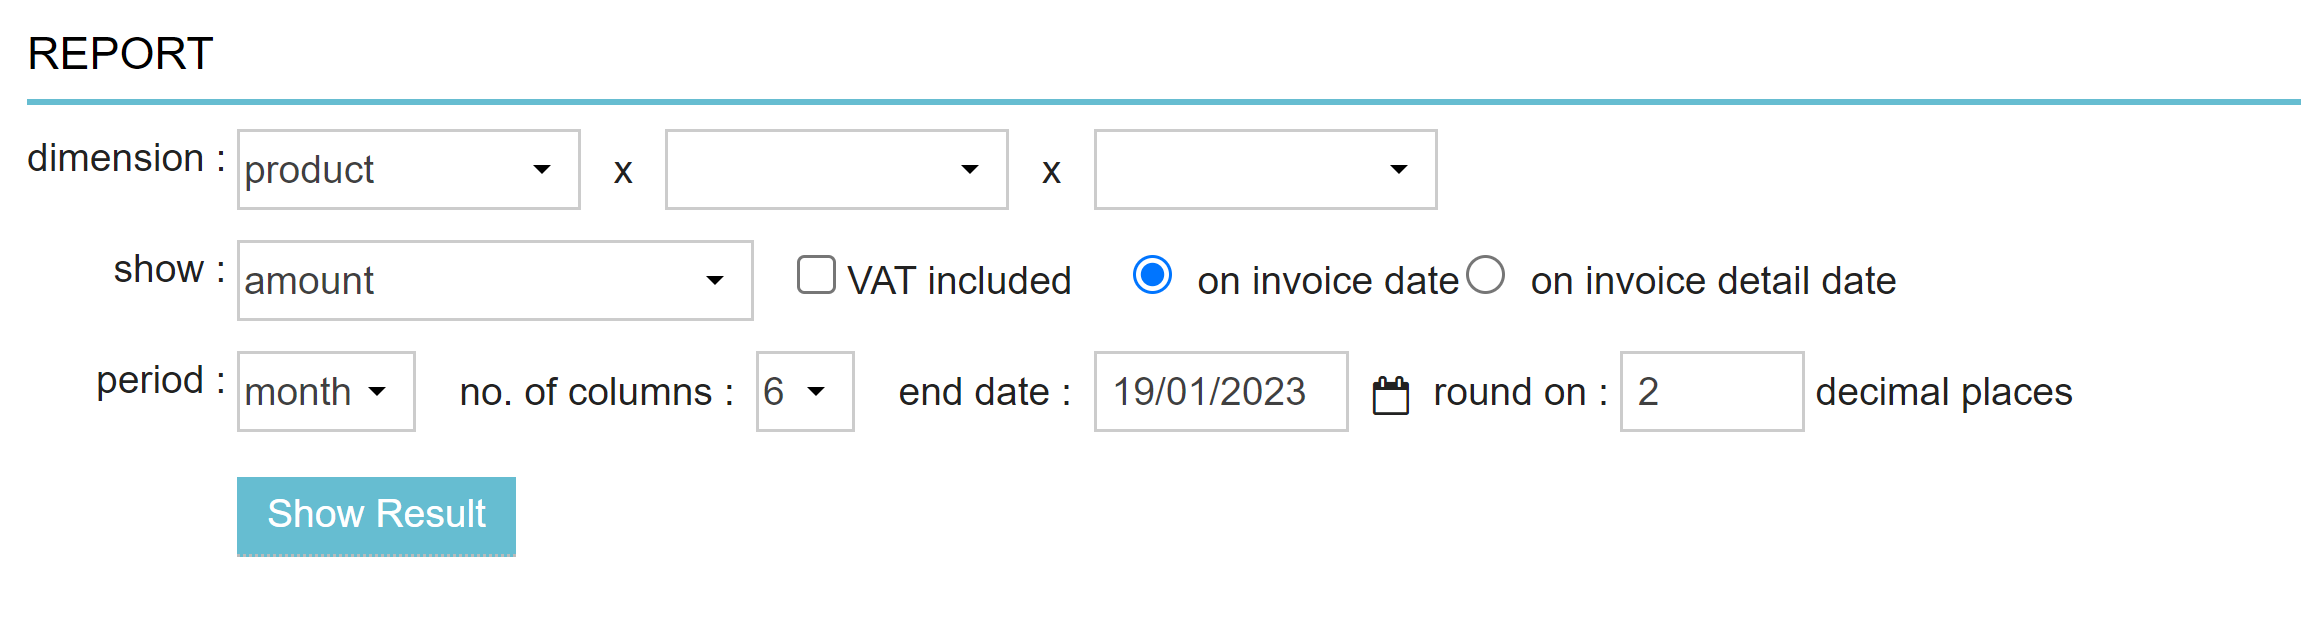
- At the top, you can set the criteria for your report. The “dimension” row controls the rows shown in your report. Each report can have up to three different dimensions.
For each dimension you can choose the specific detail you would like to see by selecting an option from the dropdown.This is box titleThe first dimension selects the primary report field which will form the first title column and the basis of the report. See the More about this section for examples. - The “show” field determines what data (values) you want to show in your report. Select the desired information for the report from the dropdown.
Note: “ATF” is average transaction fee, “ATQ” is average transaction quantity. - By checking the “VAT included” box your report will split all dimensions in the report based on the different VAT bands you have configured in Animana.
- Choose if you want the details of the report shown “on invoice date” or “on invoice detail date”. If you send monthly invoices you will see that the turnover is registered on the day that you generated your invoices (the invoice date). If you select invoice detail date then you will see the turnover on the day that the employee entered the details into the patient file.
- Set a “period” for your report. This determines what the columns of the report will specify. You can choose between day, week, month, quarter and year.
- Choose the “no. of columns” in the report. Use this in conjunction with the period to control how far back your report will go. You may select from 1 to 52 columns (52 days, 52 weeks, 52 months, 52 quarters, or 52 years).
- Set the “end date” for the report. This influences the date range you would like the report to include. For example setting an end date of 4 May 2021 will exclude all data after 4 May 2021.
- Click Show Result to show (or update) the report.
At the bottom of the report you can choose to export the date to Excel (![]() ) or PDF (
) or PDF (![]() ).
).
More about this
Example of a report with one dimension
As said, the first dimension selects the primary report field. This will form the first title column and the basis of the report.
The following report has only one dimension: Location.
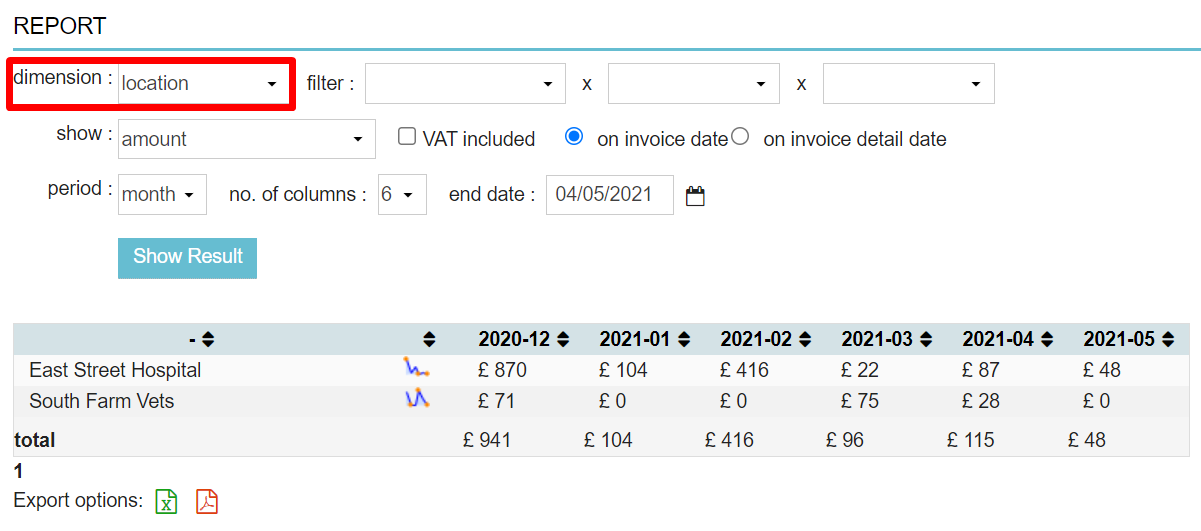
This report shows you the total amounts spent per month per location.
Example of a report with two dimensions
Adding a second dimension to the report allows you to add more detail to the report split across the first dimension.
The following report has two dimensions: Location and Product.
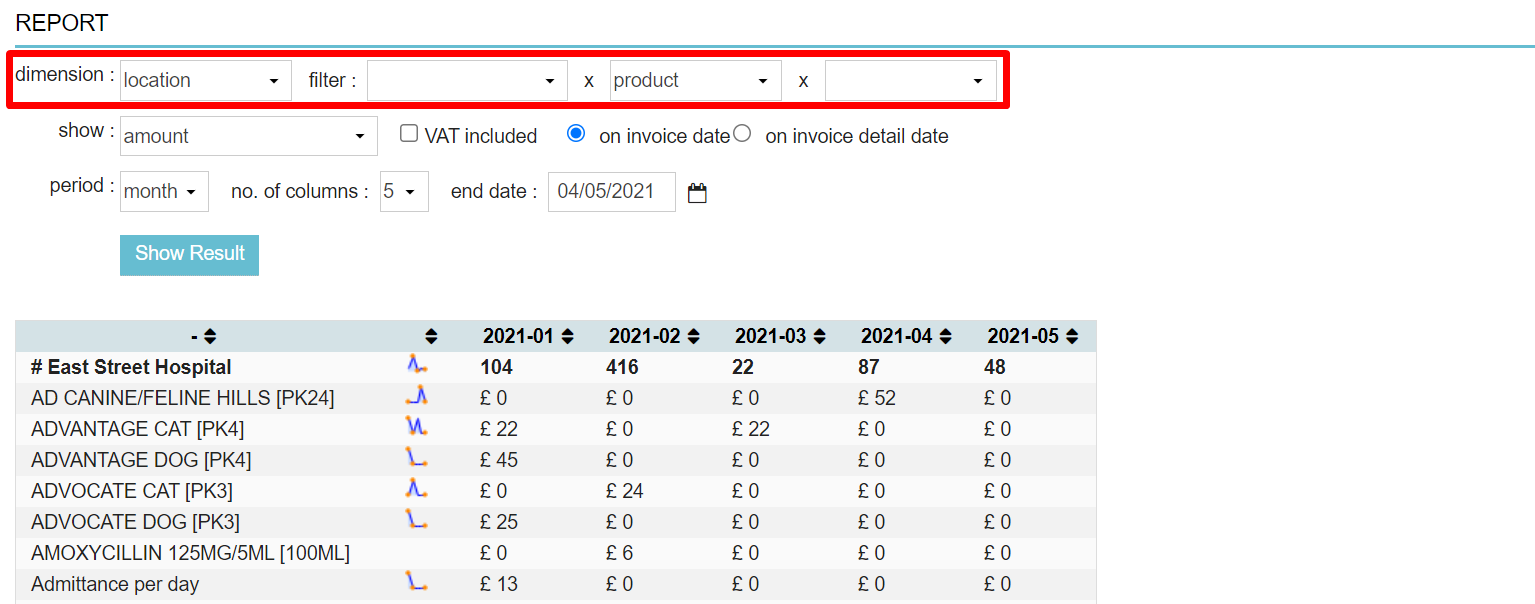
This report shows you the total amounts spent per month per location (first bold line) but also the amounts of the individual products sold per month per location.
TIP: If you are using multiple dimensions generally the first dimension should contain only a few options, subsequent dimensions will have more options.
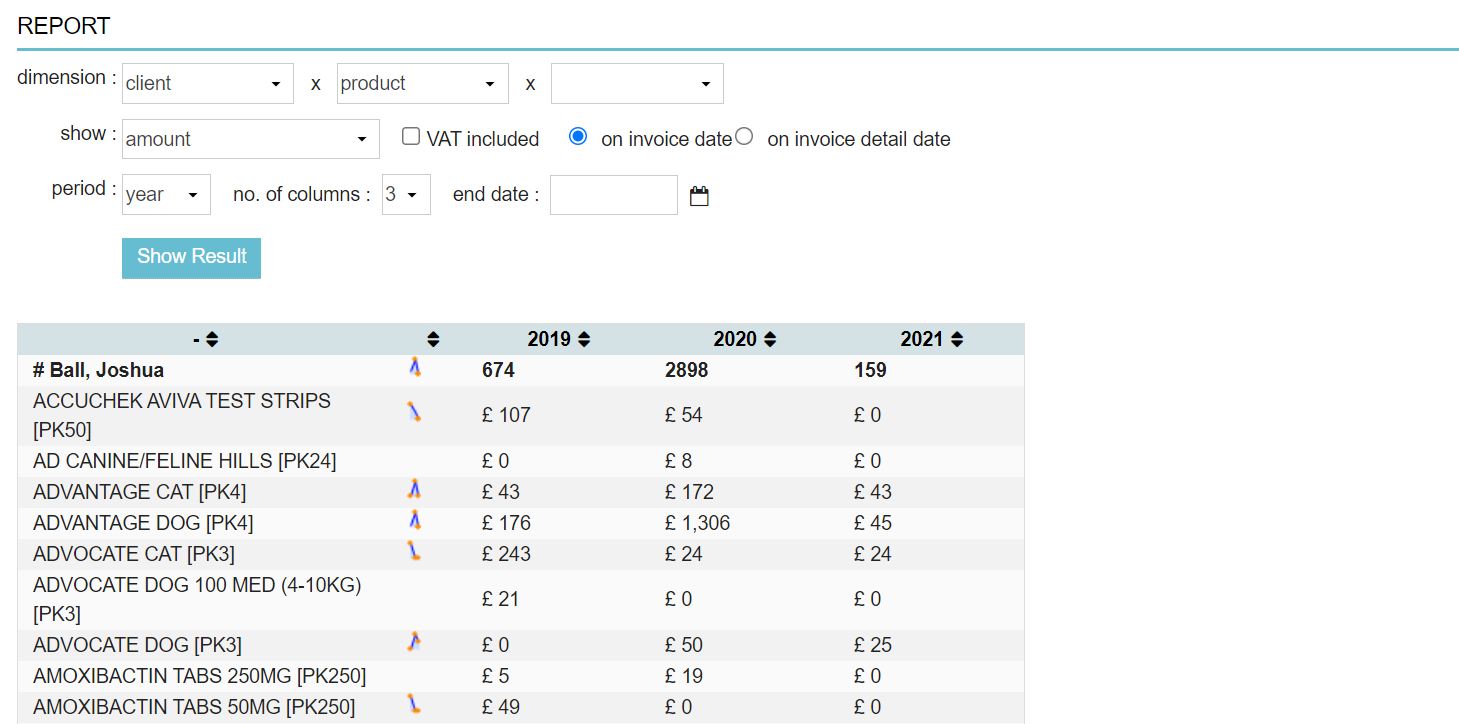
Example of a report with three dimensions
For even more detail a third dimension can be added. For example, the following report has three dimensions: Location, Product and Client.
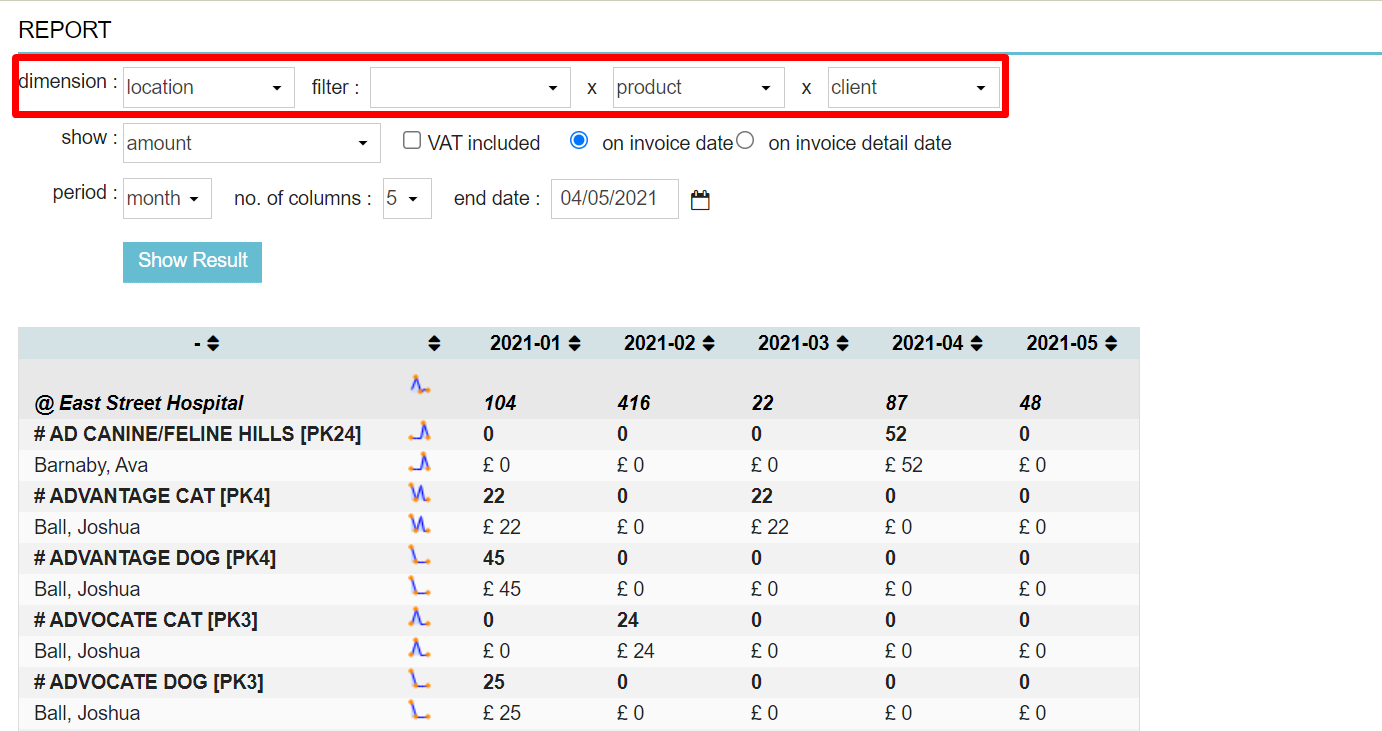
This report shows you the total amounts spent per month per location (first bold line) but also the amounts of the individual products sold per month per location (second bold line) and then further specifying the name of the client(s) that bought that specific product.
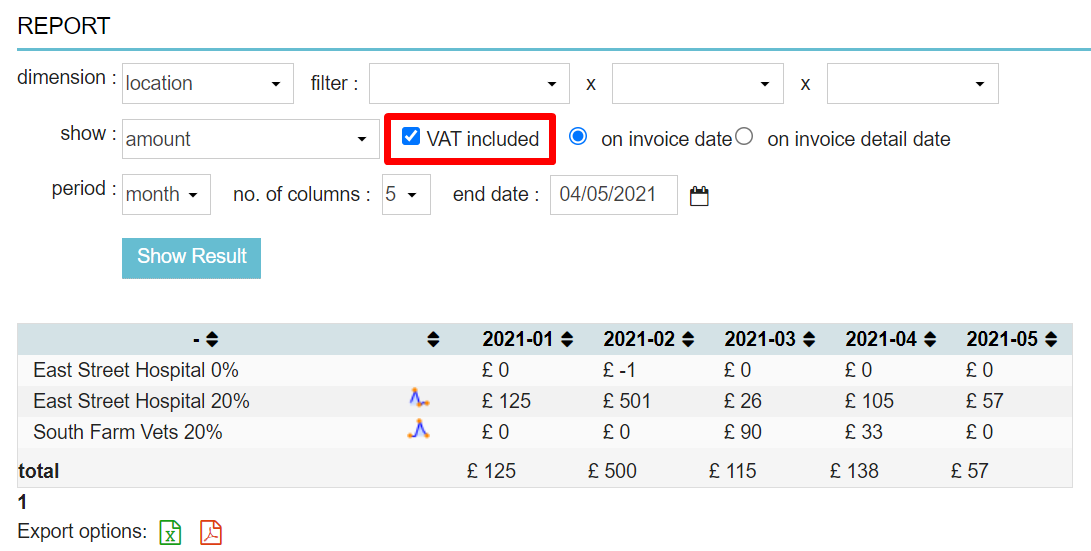
Example of a report with VAT included
By checking the “VAT included” box your report will split all dimensions in the report based on the different VAT bands you have configured in Animana (in this case 0% and 20%).
How can I quickly see the revenue for one client?
To see an overview of the total revenue of one single client, go to the client file and hover over the light bulb in the client box on the left.
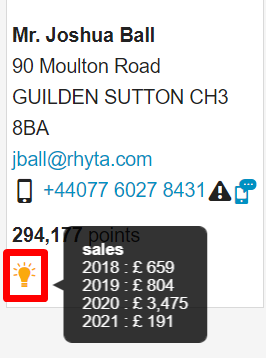
The pop-up will specify the revenue per year for that client.
When you click on the lightbulb you will be taken to the report page for that client.
Related articles
- How do I create financial reports for current and historical prices?
- How do I generate a report that shows me the products sold per employee?
- How do I access the report that shows me my active clients?
- How do I run and export an Invoice Details (Excel Export) report?
- How do I generate a report that shows unsold products?